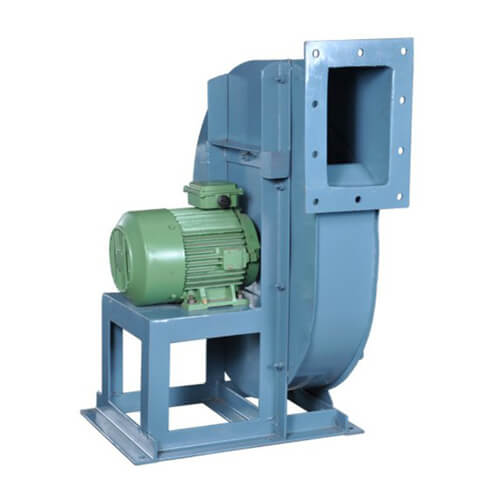
| Asset | Exhaust Blower – motor direct coupling VFD controlled | |
| Dataset | Motor Current (A), Air Flow (CFM), and Motor Speed (RPM) | |
| Dataset Explanation | All 3 data tags are recorded each day for 1 year. Sampling rate varies each day from 101 to 200 seconds | |
| Objective | Detect anomaly in Blower function using these data trend |
1. Data Visualization
Dataset contains readings from 3 sensors each collecting different readings. Motor Current records the amperage used by the Blower, Air Flow records the total airflow at the outlet of the blower and the Motor RPM records the variable speed of the motor. Readings from each day are in a table as shown below. There are 365 separate readings.

To quickly show how the trend of these values for different days, the readings are plotted next to each other below.

2. Data Partition
As with any ML problem, before we build an algorithm let’s split the dataset into Training Data and Testing Data. Since this is a time series data from the same component, we need longer training data to fully capture the behavior. Hence, we set aside about 90% of the readings as Training data. This means out of 365 days of readings, 328 days are considered training data and the rest is testing data.

3. Analysis Method
This is a time series dataset without any failure labels. The data is being collected as it is generated by the machine. For problems like these, we use autoencoders to detect deviations from the normal behavior and tag them as an “Anomaly”. Autoencoders work by establishing a normal baseline before the analysis and compare the output of analysis to the baseline; if the baseline has errors outside established thresholds then that is an anomaly. In deep learning terminology: this method works by sampling the input time series data to a lower dimensional space by Encoding and it reconstructs the data back to the higher dimensional space by Decoding.
To set up this analysis, various autoencoder parameters need to be specified which define sample size, length of the sequence, number of filters, etc. Each of these hyperparameters can be fine-tuned to tweak the model depending on the performance of the final model. Here, I have used the default model settings for demonstration purposes.
Once the autoencoder is trained using training data, it is then used on the test data to evaluate its error. The Maximum Absolute Error (MAE) for various samples is calculated, which is represented in a histogram here.

4. Identifying Anomaly
Once we have tested the model, we can use it to detect anomalies in any new sample we introduce. To establish an error threshold we refer to the plot above and take the highest error value as our base on the new sample data. Any error as calculated by the model that is higher than the above value of 120 means that it is an anomaly!
To demonstrate this, new data samples that are anomalous are introduced and the same model is used to evaluate.
The error plot for new samples (which are anomalous) is given below. The red line is the threshold limit we set based on the above section.

5. Reliability Engineering
Building a model on the dataset and testing its performance on new samples is the workflow of ML-based Predictive Maintenance. How can these results be conveyed to the Engineers who are responsible in the organization to manage & maintain these assets? We visualize the data trend and the trend as predicted by the model in the same plot. Whenever there is a deviation between the two trends, and if the calculated MAE is greater than 120, then that section of the time series is flagged as an anomaly.
First, the output of the model is fed to the visualization tool (Section 1) and laid on top of the reading:

The section where the Original Data is out of the Model Prediction is the section of concern. In this case, the performance of the Blower has drastically been lower than expected. This should raise alarm for Engineers looking at the data trend.
These anomalies can be point anomalies that happen once when the value is above the threshold we set. Or it can be a cumulative breach of values over time. Or it can be a contextual anomaly when a higher Motor Current and lower RPM (denote that motor stator core damage for example).

When an anomaly is raised, a notification should be issued for the Maintenance personnel to inspect the asset. Appropriate actions are taken based on the findings and the anomaly detection record is saved for future analysis.


