
The concept of Dynamic P-F Curve is introduced to represent Equipment Degradation with varying operating conditions. The conventional P-F Curve is static, difficult to use for maintenance planning, and needs to be re-analyzed with new readings.
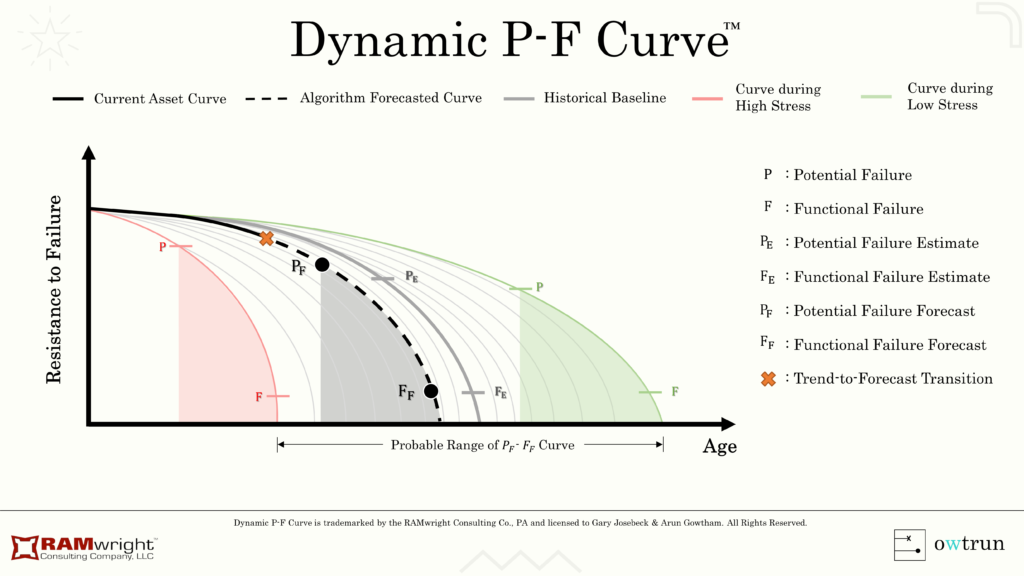
Dynamic P-F Curve connects with the streaming sensor data & uses algorithms to plot automatically. It gives the following advantages:
- Changes with varying stress & environmental conditions
- Maintenance plans can be tailored in real-time
- Systems with complex sub-assemblies can be represented in a single plot*
- Alarm points can be moved to accommodate Repair time
Need help in implementing a Dynamic P-F Curve’ for your assets?
The whitepaper was presented on this topic at the RAMS conference in 2022 by Gary Josebeck & Arun Gowtham. A copy of the full paper is below.
‘ Dynamic P-F Curve is a patented term jointly owned by Gary Josebeck & Arun Gowtham.
* Machine Learning techniques are used to reduce the dimensionality of system parameters
Related Posts

Video: Transforming Industrial Maintenance with AI & IIOT

How to deal with ‘False Positives’ from ML algorithms?