

| Asset | Li-ion Battery |
| Objective | Predict RUL – Charging Cycles left in battery using data from initial small batch |
| Dataset | 124 Li-ion battery cells with 1.1 Ah capacity & 3.3V are run-to-failure and the data is collected. Dataset split into Training & Test data |
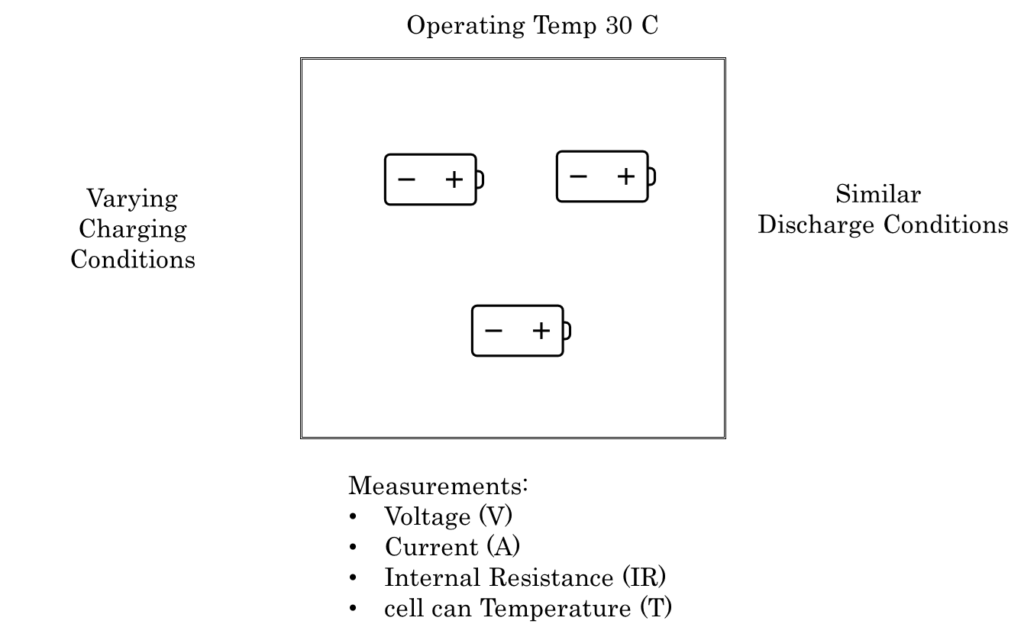
| Dataset Explanation | Each data file has Cell Serial, Charging Policy, No of cycles ran, and Measurements. Measurements are voltage, capacity, temperature, internal resistance, and charge time. Dataset source is in reference below. |
Batteries are being deployed at an increasing pace for a variety of applications. Electric vehicles (EV), Energy Storage Systems (BESS), Consumer appliances are some of the prominent uses. Reliability of the batteries is an important consideration given the dependence on them & the complexity of these systems. Entire academic research groups are dedicated in making reliable batteries by optimizing chemistry, materials, design, and production. Industrial operators have only maintenance to control.
Predictive Maintenance of batteries will enable the operators to avoid unplanned downtime by planning maintenance. Physical models used in simulating the degradation of batteries rely on the chemistry. This makes it difficult to scale-up, use at varying conditions, and apply at non-linear degradation. A machine-learning based model will detect battery degradation earlier, with accuracy, with interpretability, at varying operating conditions. This post is an example of one such Machine Learning model that uses data from only few initial charging cycles to predict life.
The set up is as follows:
1. Data Visualization
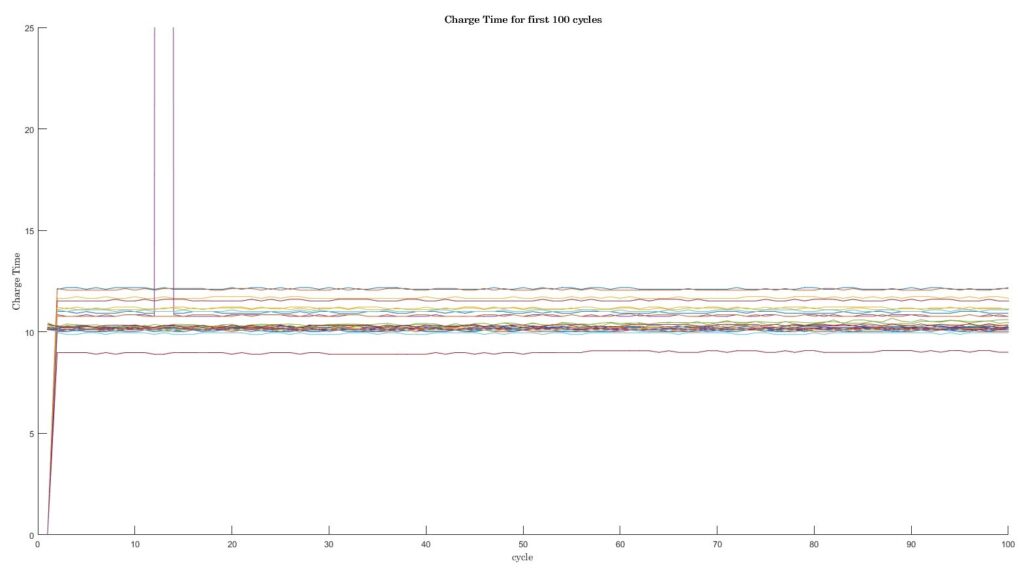
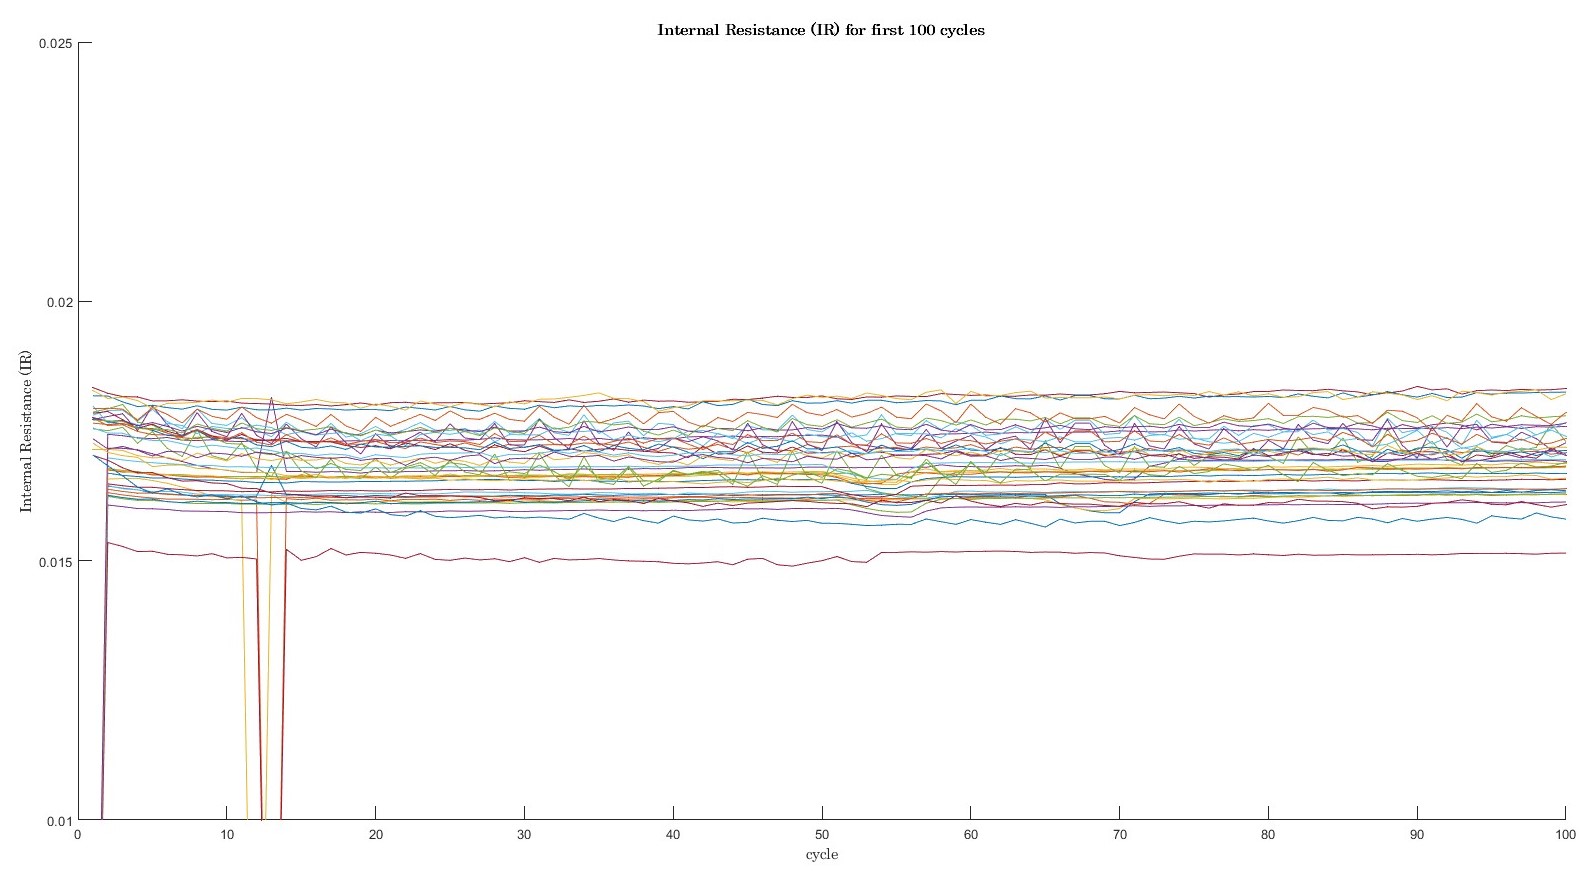
The straight forward way to predict Reliability is to establish a relationship between battery life (cycles) & readings. However, plotting the readings over cycles shows that the values tend to be flat for initial cycles and then drops-off drastically as it reaches EOL.

Looking at individual readings for the first 100 cycles to see if any distinctive pattern emerges. Looking at the plots below, we can conclude that IR & Charge time cannot be used as Health Indicator for predicting failure.
2. Feature Selection
Discharge Capacity is relatively flat in the first 100 cycles. Is there a different indicator that would highlight the difference between the Discharge capacity from cycle 1 to cycle 100? We know the Voltage range is similar across each cycle. Plotting the discharge capacity against voltage for different cycles gives an indication. Research has shown that the feature “Discharge Capacity at different cycles” has shown to be a valid indicator.
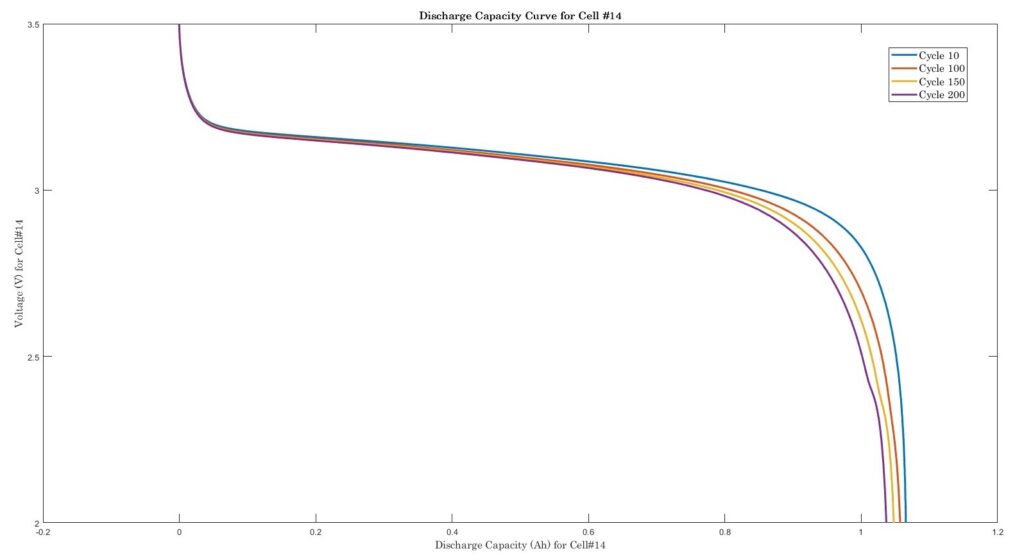
Plot of Discharge capacity vs Voltage shows that the difference between the Voltage Curves increase as the number of cycles increase. Exploring if the same pattern is observed in all cells. One way to quantify, if Delta Discharge Capacity can be used as a health indicator is to plot its Variance against known cycle life.
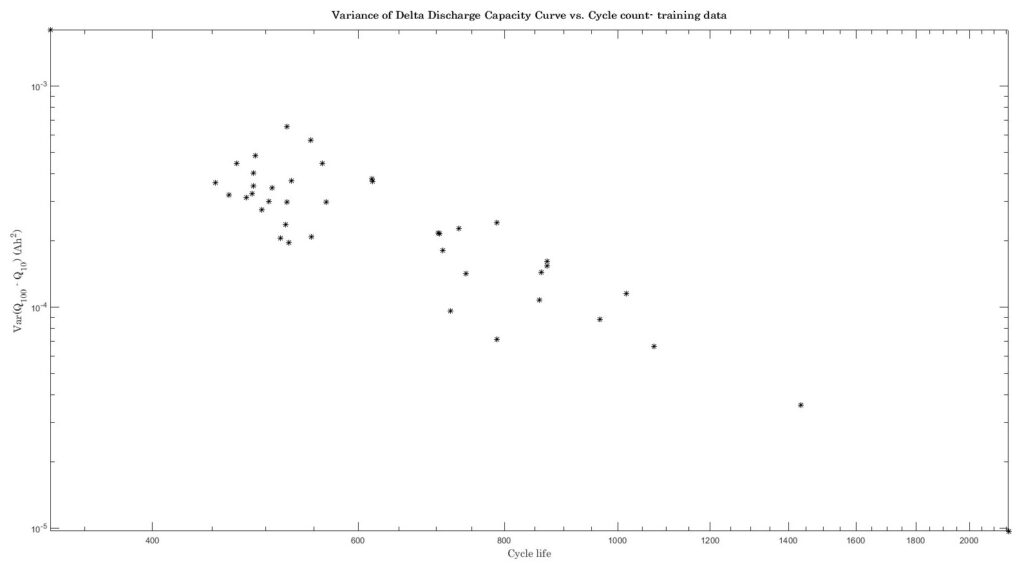
The “Variance of Delta Discharge Capacity vs. Cycle” plot shows a trend. It is decreasing as the cycle count increases.
Using this feature as the “Health Indicator” and applying a ML algorithm.
For a complex system like Battery, using only one feature as health indicator is prone to less accuracy. But for this examples, we will explore results using only one feature and in later posts explore using multiple features as Health Indicator.
3. Health Indicator
Using the Health Indicator, we can build a regression model that fits to the above data. The resulting Prediction vs. Actual plot is given below:
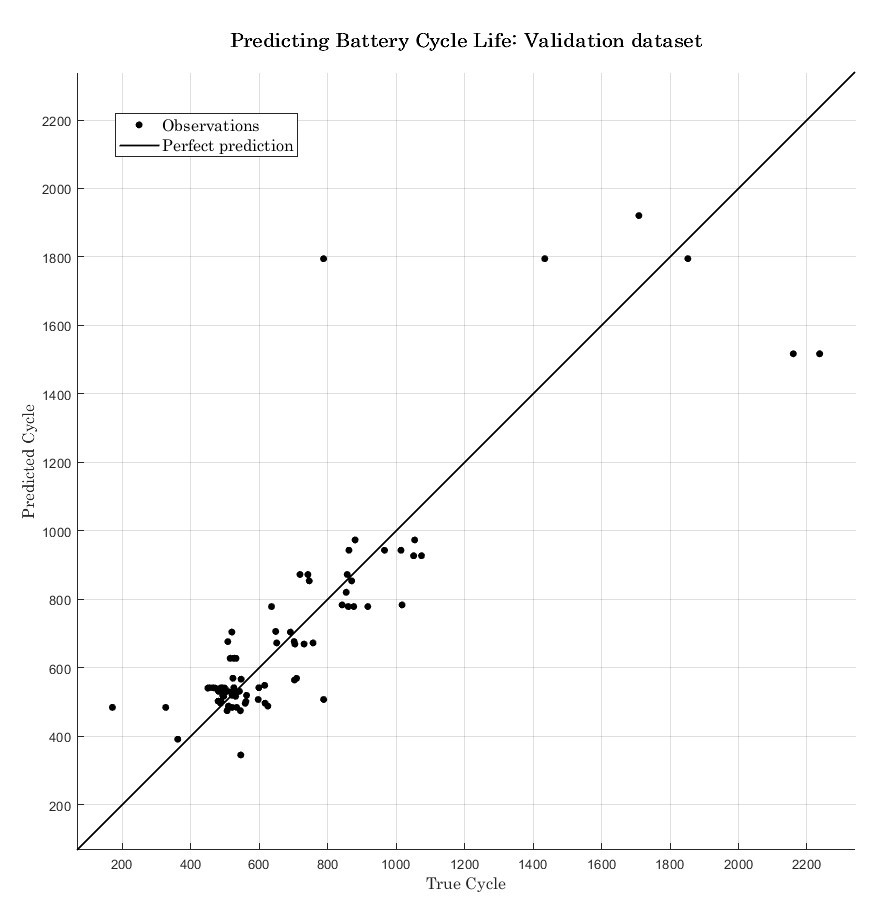
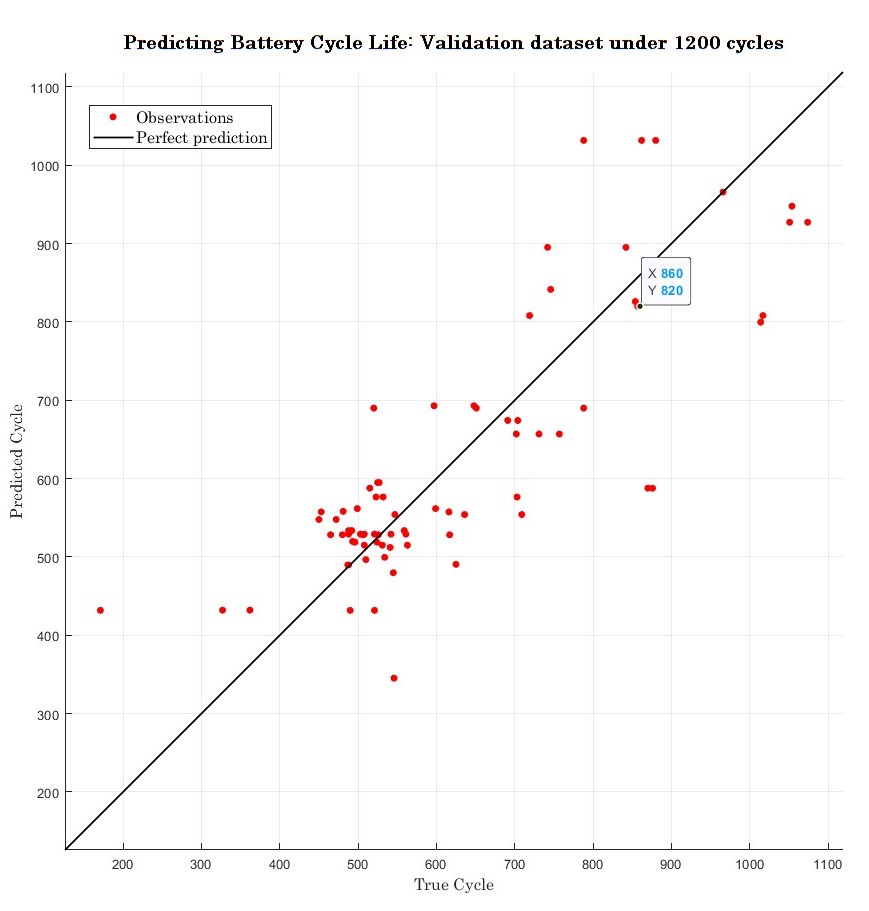
Data is clustered around the fitted line for cycles under 1200, but as the cycles increase the residuals also increase. Few cells that last for a longer cycle life is skewing the predictions for all the cells. Exploring a second model for cells that had cycles only less than 1200. The Predicted vs Actual pot for this condition is given below.
4. Reliability Engineering
The performance of the two ML models are evaluated by using a Test dataset that has not been used before. The results of the analysis are given in the table.
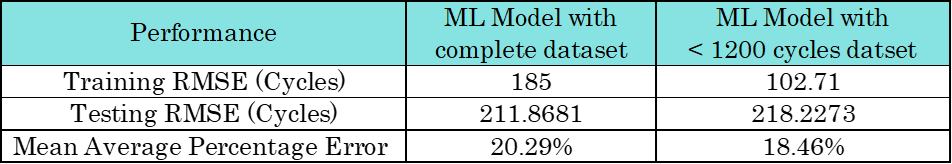
RMSE error shows that the current ML model with only one feature is predicting battery life within ~79% accuracy. For cells in earlier life, the prediction accuracy is marginally higher at ~81%. With this result, a new battery that has entered service now can be monitored and it’s End-of-Life (EOL) is predicted.
For example when 4 new batteries are put into service, it’s Discharge Capacity is measured at time 10th cycle & 100th cycle of any charging protocol, then the battery cycle life is predicted by model as:
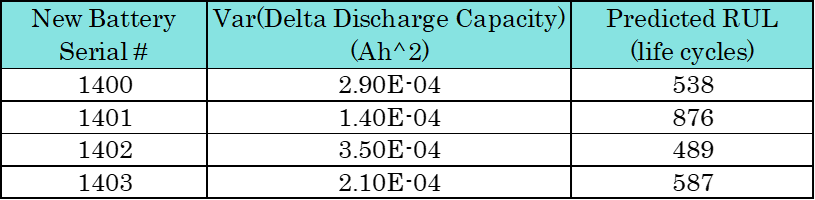
From this prediction, the Reliability & Maintenance team will make decisions on the operation of these cells. When a application calls for at least 600 cycles, then from above prediction we can conclude that batteries 1400, 1402 & 1403 will not meet the goal. These unreliable cells need to be replaced. Alternatively, the user might decide to delay the cycle to meet a prolonged time.
The article explains how data from batteries are used to predict the Remaining Useful Life (battery cycles).
References:
Related Posts
Demo A.3: Analysis of a Fuel Cell System
Demo C.2: Predicting RUL of Fleet Units